Ranking Factor
The term “Ranking Factors” describes the criteria applied by search engines when evaluating web pages in order to compile the rankings of their search results. Ranking factors can relate to a website’s content, technical implementation, user signals, backlink profile or any other features the search engine considers relevant. Understanding ranking factors is a prerequisite for effective search engine optimization.
Explained Ranking Factors: Rank Correlations And Their Causal Interpretation
Since 2012, Searchmetrics has published our annual “Ranking Factors Study”. It’s an excellent report, and a lot of work goes into it from our statisticians, mathematicians, senior management and our ranking/search experts, gathering data from all around the world on what affects the rankings of a website. But, what is our definition of a “Ranking Factor”? How – exactly – is it analyzed? What’s a correlation? What does this report mean to you, and why should you take any notice of it? Often, misunderstandings arise regarding the interpretation of data and its causal relationships, so here is an explanation of the background and our approach to interpretation of the data. In clear English. For you.
Note: A high correlation does not necessarily mean it’s a ranking factor!
Correlations And Rank Correlation Coefficients
Every year we analyze the top 30 search results for 10,000 keywords – that’s nearly 300,000 URLs – in our Ranking Factors study. We analyze them using a number of factors that we expand from year to year – e.g. the number of backlinks , text length and keyword & content features. The underlying question is always: What differentiates pages that have climbed the rankings, as opposed to those who are placed further back in the SERPs? Do they have more backlinks / text / keywords / etc.?
Based on the existence and specification of factors examined across the top 30 positions, we calculate the “rank-correlation coefficient” (here the definition from Wikipedia ) by using the Spearman correlation. These indicate the relationship between two variables – namely the ranking on the one hand and the occurrence / existence of each factor on the other.
The differences on the search result positions compared to the value studied – i.e. the correlation – can be detected and shown on a graph as a curve of average values for each item.
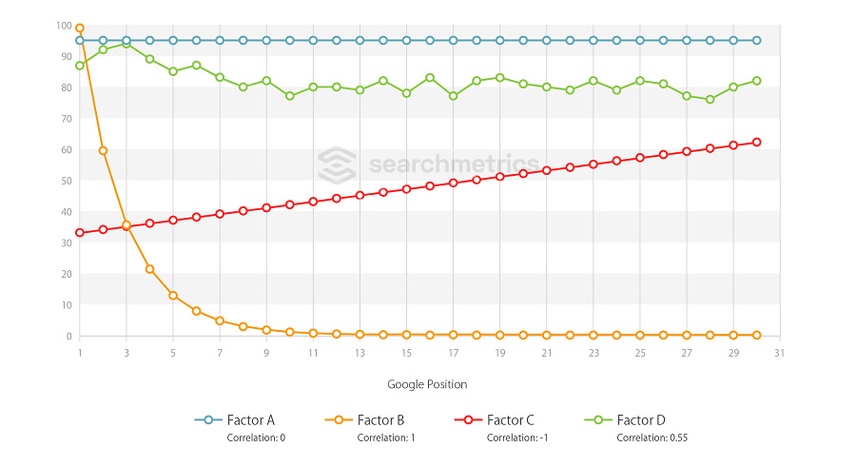
In the graph, four example correlations and the respective curves are shown.
- Factor A: Zero Correlation – linear curve, horizontal / high average
- Factor B: Positive Correlation (highest) – exponential function, falling
- Factor C: Negative Correlation (lowest) – linear curve, rising
- Factor D: Positive Correlation – irregular curve, falling
Explanation: Correlation Calculation And Interpretation Approaches
The y-axis indicates the average value for all 10,000 URLs studied at position X (x-axis). Factors with the value “zero”, according to our analysis, point to no measurable correlation between good and bad Google results. The higher the value of a correlation, the greater, and more regular, the differences between positions. Values in a negative range are best understood with the opposite statement positively interpreted.
Simply put, the larger the differences from position 1 to 30, the higher the correlation value. To interpret the factors, average values are always used. For example, factors B and C from the above graph have the same correlation value (that is: 1), but are completely different regarding their respective curves. For factor A, however, the average value is 95 (y-axis) for each position (x-axis), but could even be at 5 (y-axis). The correlation value would remain identical at 0, but the interpretation of the factor would be completely different.
Search Engine Algorithms And Ranking Factors Of Google & Co.
Search engines work by using algorithms to evaluate websites by topic and relevance . This evaluation is used to structure pages in the search engine index , which ultimately results in user queries displaying the best possible ranking of the results display. The criteria for the evaluation of web pages and to produce this ranking are generally referred to as ranking factors.
The reasons for this are straightforward: the exponentially rising number of documents on the Internet – and in the search index – makes it impossible to rank these pages without an automatic algorithm, despite the existence of human ‘quality raters’. This algorithm is both mandatory (order, after all, requires a pattern), and, at the same time, the best-kept secret in the Internet business, because for search engines, it is essential to keep the underlying factors that make up the algorithm strictly confidential.
This inherent secrecy has less to do with competition between search engines than it has to do with more basic reasons: If the ways to obtain good rankings were widely known, they would become irrelevant as they would be constantly manipulated. No one but Google knows what the real Ranking Factors are. We analyse data via rank correlation analysis to produce our findings based on the properties of existing, organic search results. From these, we conclude what the Ranking Factors, and their respective weightings, could be. Our immense database provides a reliable foundation for these analyses.
Black Hat SEO: Keyword Stuffing, Cloaking & Co.
At the beginning of the search engine age, Google considered pages relevant for specific topics where the subject-associated search terms (keywords) were frequently used. Site operators soon took advantage of this knowledge and achieved very good positions in the SERPs by ‘stuffing’ pages with keywords, enabling their often non-relevant pages to be found on well ranking positions for the intended search terms.
This generated not only real competition between search engines and SEOs, but produced the myth of the ranking factor. The goal of semantic search created a network of criteria that were initially strictly technical (e.g. the number of backlinks), but were added to by less technical components (e.g. user signals).
This development, along with the pursuit of the optimum result, has culminated in the constant evolution of ranking factors. The endless feedback loop of permanent-iterative update cycles is designed purely to generate search results that offer constant improvements to the individual searcher. The structure and complexity of ranking factors, added to the strong influence of user signals, is designed to produce the most relevant content for the user.
From a business perspective, long-term success can be achieved by using a sustainable business strategy based on incorporating relevant quality factors to maintain strong search positions. This approach means a disregard of negative influence options and a clear focus on relevant content, at the same time combating spam and short-termism.
Causation ≠ Correlation
We are not Google. The analysis and evaluation of ranking factors using our data is based upon well-founded interpretation – not speculation – of the facts; namely the evaluation and structuring of web site properties with high positions in the search results .
The ranking evaluations of Searchmetrics are exact, fresh and based on much data. We at Searchmetrics aggregate billions of data points on a monthly basis – and here’s the 64-million dollar question: Which factors distinguish well-placed sites from those with lower positions in the Google search results?
We compare the properties of Web pages with the sum of their positions at Google and derive a structured list of more or less weighted factors. So, if in the front positions of the investigated SERPs, for example, many pages contain the keyword in the title tag, then we recognize it as a high correlation with a good ranking. These correlations can therefore offer conclusions as to which pages displayed in the top search results listings have features that are similar.
However, it is necessary to point out that correlations are not synonymous with causal relationships, and hence there is no guarantee that the respective factors actually have any impact on the ranking – or are ever used by Google as a signal. What we do at Searchmetrics, however, is interpret these correlations.
“Cum hoc ergo propter hoc” – Logical Fallacy And Illusory Correlations
Plants wither when they get no water: the house is warm when you turn the heating up – and because one site has many social signals, it climbs to #1? Stop!
There are many examples of illusory correlations or assessments which are referred to as “logical fallacy” (Cum hoc ergo propter hoc – see Wikipedia ). As an example, the co-appearance of phenomena like the number of storks and the higher birthrate in certain areas, or the relationship between sales of ice-cream and increased incidence of sunburn in the summer. But do you really get sunburn from ice-cream? Of course not. These examples show a (illusory) correlation, not a causal relationship. (Find more examples here )
We want to avoid logical fallicies and illusory correlations at all costs, and our experience shows that it is too easy to evaluate a ranking factor as having a causal significance where none exists. We prefer to work using a “rank correlation coefficient”, and this necessitates an evaluated interpretation and a sound database.
Database for Searchmetrics Ranking Factors
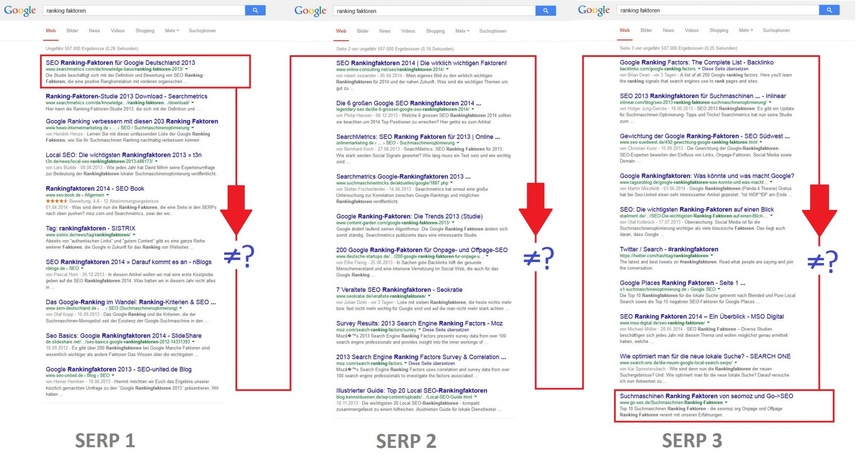
Our analysis is based on search results for a very large keyword set of 10,000 search terms for Google U.S.. The starting pool is always the top 10,000 search terms by search volume, but from which specific navigation oriented keywords are extracted in order not to distort the evaluations. As navigation-oriented keyword searches are considered to be where all results but one are irrelevant to the searcher, more or less (e.g.: “Facebook Login”).
Our database for the Ranking Factor analyses are always the first three organic search results pages. The keyword sets from consecutive years coincide by more than 90 percent with the database from the previous year, as a rule. Here we have sought a middle ground, to take two factors into account, namely the preservation of the “greatest common denominator” as the optimal basis for comparison with the previous study, and on the other hand, taking into account new keywords, which have grown in search volume in the top 10,000.
The database at Searchmetrics is always current. Therefore, new, relevant keywords are used for current analyses, such as “Samsung Galaxy S5” or “iPhone 6”, which did not exist previously.
Binary And Numerical Factors – Specification Versus Existence
The factors examined are divided into binary and numerical features. This means there is an inherent difference in nature of the factors used in this analysis. This difference should not be neglected in the interpretation of the values.
Elements that are described using binary factors – such as a meta description on the page – are either present or not. There are no gradations. There are also elements with graded characteristics that change in differing degrees. For example, a URL may have zero or six thousand backlinks – but each value in between is also possible.
These numerical factors are in some senses “better” for studies using correlation calculations such as Spearman, with rows and / or ranking principles based on gradations. When it comes to interpretations based on the pure correlation value alone, the statements for numeric factors are often more significant.
To support the validity of the correlations of binary features in our study, therefore, an average value must be specified in the rule. For example regarding the factor “Existence of Description”, it may be that there is only a close to zero correlation with rankings, but in fact almost 100% of all URLs have a description (see the example correlation for factor A above).
Correlation Values Versus Average Values And Curves
The correlation values plotted as a bar are always calculated on the basis of all available data per feature, so for one or 10,000 keywords, each graph line has 30 values per keyword.
Average values are calculated from these mean curve values, which also leave out the top five percent of each feature to allow for the smoothest possible curve and a manageable scale (Y-axis), otherwise some lower averages in respective curves would not be seen. Also, individual median and mean values are calculated for features disregarding the top five percent of findings.
The Brand Factor
One of the constants in the ranking factor studies is an interesting peculiarity in the data that we have dubbed the “brand factor”, present in many factors and observations.
What we mean by brand factor is the observation that websites from high profile brands or with a certain authority generally occupy the very top positons in the rankings, even if they disregard particular factors that the URLs that rank slightly lower adhere to.
For example, on average brands tend not to have a h1-tag on their page, their content has a lower word count and the keyword is not found in the description of the meta-title as often. In a nutshell: from a SEO perspective they are less optimized. On the other hand, brand websites typically feature many more backlinks and social signals than other URLs.
Google is already very efficient at identifying brands from particular sectors and at allocating their URLs a preferential ranking. Values like recognizability, user trust and brand image are also reflected in the SERPs to a certain extent.
Intention: Why Ranking Factors?
It’s fair to say that even Google itself doesn’t know how its own algorithm is made up, so complex have the evaluation metrics become.
The objective of Searchmetrics “Ranking Factors” studies is not to produce a gospel of absolute truth. Instead, we consider Searchmetrics studies to be a methodological analysis from an interpretative perspective. What this means is that we aim to provide the online industry with easy access to a data toolbox. By using this toolbox, the industry can make informed decisions based on our intensive research across a wide spectrum of criteria.


