SEO Trends and Predictions for 2023
SEO is rapidly becoming a key business priority for companies that understand its value and impact. Case in point:
- 82% of marketers reported SEO positively impacted marketing performance and goals in 2022.
- 92% reported content marketing positively impacted marketing performance and goals.
As we head into another year of economic uncertainty, marketing leaders are under pressure to prioritize strategic investments in top-performing channels to maximize results despite most marketing budgets remaining flat for 2023.
Today’s digital marketers need to stay current on the SEO and content marketing trends that will drive the most impact to achieve the increased goals and metrics set for 2023 and adapt to the overall volatility forecasted for search. Top trends to incorporate in your SEO strategy include:
- The rising importance of visual search
- Identifying the role AI should play in your SEO workflows
- Expanding search strategies beyond Google
Methodology
To learn more about the current state of digital marketing, emerging SEO trends, and content marketingContent Marketing
Content marketing is a marketing discipline with the goal of increasing awareness and scope for products and brands in the desired target group with content published on the web and offline.
Learn more predictions for 2023, we ran two independent surveys of a wide range of marketers at organizations of all sizes, from SMBs to enterprises. Data is sourced from the 2023 Impact of SEO & Content Marketing Survey, run by ClickZ in collaboration with Conductor, of 117 global marketing leaders and digital marketers. Additional data is sourced from the Conductor SEO & Brand Research Survey of 341 marketing leaders, SEOs, and content marketers.
In total, nearly 500 marketing and SEO professionals responded to our surveys and shared their insights on the future of SEO to inform the trends and predictions found in this report, with additional commentary from search industry experts: Aleyda Solis , Lily Ray , and Patrick Reinhart .
Download the complete 2023 SEO Trends & Predictions Report for unrestricted access to the data analysis from the surveys, along with even more insights, trends, and predictions. Here’s a sneak peek of what’s inside the report.
The Current State of Marketing
2022 Year in Review: The Impact of SEO on Marketing Performance and Goals
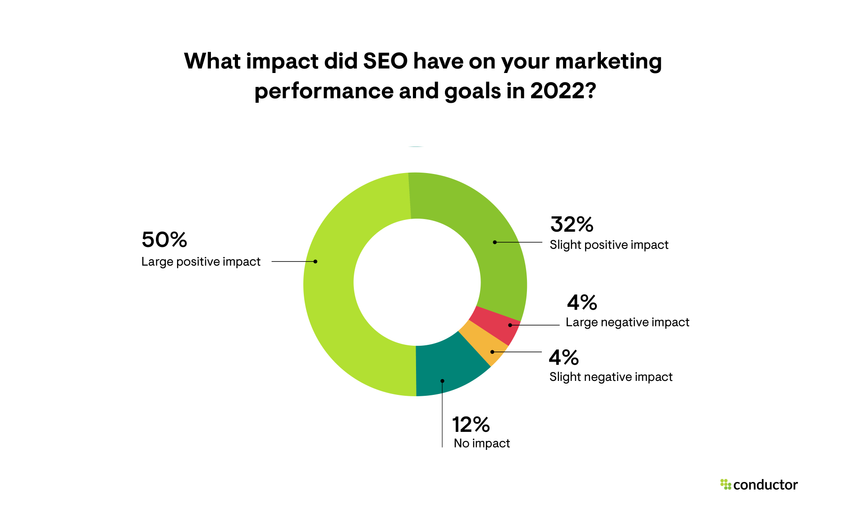
82% of marketers reported SEO had a positive impact on marketing performance and goals in 2022.
Takeaway
For 2023 and beyond, SEO will only continue to increase in importance for all businesses, regardless of size, due to its cost-effectiveness, ability to increase visibility and reach, and long-term benefits.
![Aleyda Solís, International SEO Consultant & Founder, [object Object]](https://cdn.sanity.io/images/tkl0o0xu/production/87a1f817c8f42ea11c23fda5f2aef5c31bfc83b5-1271x1271.png?dpr=1&fit=min&h=100&q=95&w=100)
Despite the higher level of competition and quality needed to rank well in competitive markets, as well as shifts in Google search results' visibility that can end up harming CTR in certain scenarios, it's outstanding to see that SEO efforts pay in such a high share of projects. I expect that due to the current and expected economic scenario, this plays a key factor when deciding which channels to keep investing and double down on.
Trends & Predictions
Expect Google’s volatility to intensify moving forward.
- Think: Overlapping updates, faster rollouts, transitioning away from more traditional ranking factors, and AI experimentation in SERPs to answer more questions directly.
![Patrick Reinhart, VP, Services and Thought Leadership, [object Object]](https://cdn.sanity.io/images/tkl0o0xu/production/6a9a2fc24cc749de3cd40e8d04ab10beb1d2fb0a-552x436.jpg?crop=focalpoint&dpr=1&fit=crop&fp-x=0.5204545454545452&fp-y=0.5&h=100&q=95&rect=47%2C0%2C482%2C436&w=100)
Visual search will become more prominent as Google looks to compete with the growing popularity of Instagram & TikTok search.
- Following SEO best practices for visual elements (alt tags, load speeds, responsiveness, etc.) will become more critical as the popularity of visual search grows. But this isn’t limited to images; now is the time to prioritize and invest in video marketing and video SEO.
- Many marketers are likely to forget Universal Analytics is going dark on July 1, 2023.
- Recommendation: Implement strategies now to set up GA4 or risk significant websiteWebsite
A website is a collection of HTML documents that can be called up as individual webpages via one URL on the web with a client such as a browser.
Learn more performance analytics challenges mid-year.
- Recommendation: Implement strategies now to set up GA4 or risk significant websiteWebsite
2022 Year in Review: The Impact of Content on Marketing Performance and Goals
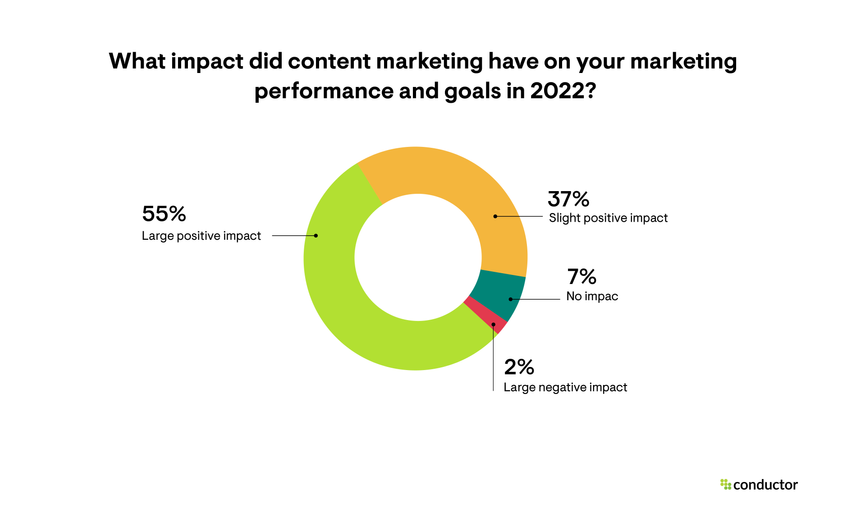
92% reported content marketing had a positive impact on marketing performance and goals in 2022.
Takeaway
Content marketing remains a highly effective marketing strategy that produces a positive impact nearly 100% of the time. This data reaffirms content marketing is a channel worth investing in for all companies, regardless of size.
Trends & Predictions
Organizations, especially enterprises, that have seen the impact of content marketing on business objectives will likely increase investments in content marketing across all channels in 2023 and beyond.
2023 will usher in a wave of companies experimenting with AI-generated content from emerging tools like ChatGPT in hopes that it can replace the investment in content writers or marketers.
- As CNET learned , AI-generated content will not replace content marketers. This type of content needs fact-checking and often includes plagiarization. Additionally, Google has already begun flagging poor or spammy AI-generated content.
- Instead, ChatGPT and similar AI innovations will provide the most impact by automating time-consuming tasks like topic generation for content marketers.
- Remember: These innovations will not replace content marketers. Content marketers remain a core business need; invest in them.
Download the complete 2023 SEO Trends & Predictions report for additional insights and commentary on:
- The top lead generation channels for marketers in 2022
- SEO, content, and paid media budget allocation trends for 2023
- Overall marketing goals for 2023
The State of SEO in 2023
2023 SEO Technology Requirements
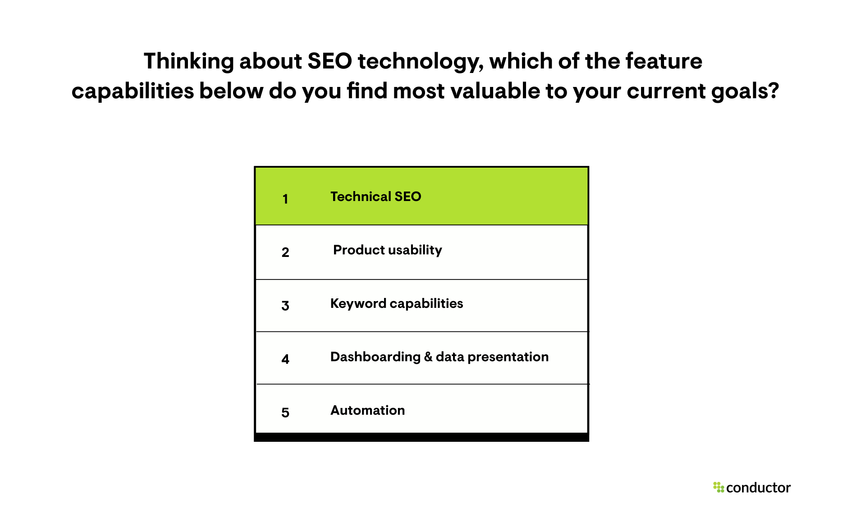
Takeaways
Technical SEO was the clear winner when respondents were asked to rank a list of 14 SEO technology capabilities based on which they value most.
This comes as no surprise given the increasing competitionCompetition
Businesses generally know who their competitors are on the open market. But are they the same companies you need to fight to get the best placement for your website? Not necessarily!
Learn more within search. Forward-thinking organizations recognize that a strong technical SEO foundation will become a key differentiator to increase overall organic visibility and set planned content up for the highest likelihood of ranking in the top 10.
Trends & Predictions
Technical SEO is one of the capabilities most often found lacking in modern SEO technologies, and it’s also increasingly difficult to find SEOs with comprehensive technical SEO expertise. Leaders are catching on and looking to overcome these challenges by investing in SEO technology capable of analyzing, monitoring, and implementing technical SEO improvements .
![Lily Ray, Sr. Director of SEO & Head of Organic Research, [object Object]](https://cdn.sanity.io/images/tkl0o0xu/production/0d9e4ea698af1b14676e83dd11ebee1e89d46be1-800x800.png?dpr=1&fit=min&h=100&q=95&w=100)
I would agree that technical SEO is becoming increasingly important to organizations. Technical SEO has become more complex over time, with the advent of new challenges with JavaScript rendering, crawl budget limitations, increasingly large and complex websites, mobile-first indexing, the Page Experience signal, and more.
Not only do these concepts require significant technical chops to analyze and address, but keeping up with the latest trends and developments in technical SEO is also a full-time job. Beyond that, when it comes to analyzing, measuring, and reporting on data from large websites, skills like big data visualization, Python, SQL, and other programming languages become invaluable. The types of SEOs that can handle these challenges effectively are harder to come by than SEOs who know how to do keyword research and optimize content.
Enterprise organizations relying on SEO technologies that don’t provide comprehensive functionality across these five top-valued categories risk wasting limited spend on solutions unable to help marketers achieve core business objectives.
- Translation: SEOs must become advocates for the SEO technologies that best meet business needs and educate leaders on the potential impact of sacrificing core functionality requirements to save on costs.
Download the complete 2023 SEO Trends & Predictions report for additional insights and commentary on:
- Top SEO technology pain points for marketing leaders and SEOs
- Top SEO priorities for 2023
- The current state of SEO reporting
- The role and impact of SEO in content marketing
The State of Content Marketing in 2023
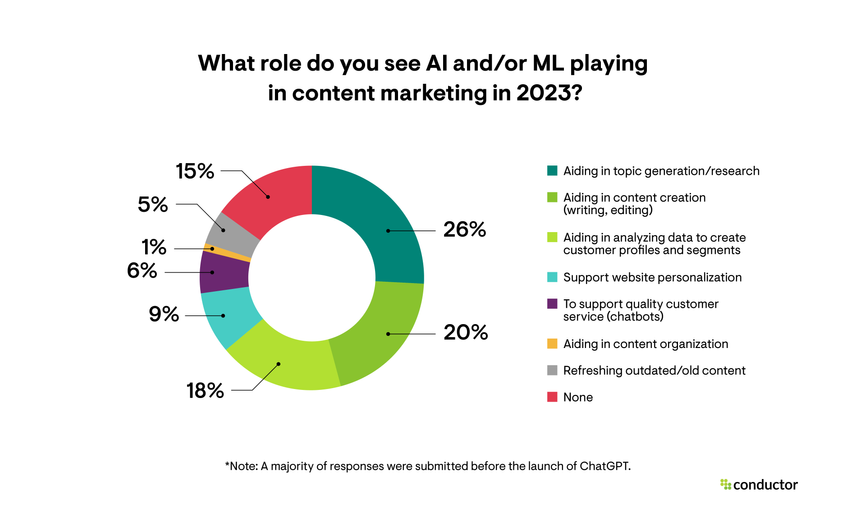
The Role of AI in Content Marketing in 2023
Takeaways
1 in 4 respondents believes topic generation and research support will be the most significant role AI/ML play in content marketing in 2023.
1 in 5 marketers believes AI/ML will play a role in the writing and editing stages of content creation.
Trends & Predictions
Disruptive AI/ML-powered innovations (think: ChatGPT) will become valuable tools for SEOs and content marketers to offset tedious tasks like data analysis, keywordKeyword
A keyword is what users write into a search engine when they want to find something specific.
Learn more research, and topic generation. But AI is not the new Google; keep this in mind.
- The Good:
- From a search engineSearch Engine
A search engine is a website through which users can search internet content.
Learn more and user perspective, more emphasis and value will be put on unique and original content written by humans for humans vs. AI-generated content. - Regardless, expect to see a wealth of experimentation from search leaders like Google implementing AI innovations to answer questions and provide more value directly on SERPs.
- From a search engineSearch Engine
- The Bad:
- OpenAI Co-Founder Sam Altman tweeted , “ChatGPT is incredibly limited, but good enough at some things to create a misleading impression of greatness.”
- Many brands will make the mistake of thinking AI-powered tech can take over content creation in 2023 and invest in these options over human writers and editors (See CNET’s AI-generated content fumble ).
- It’s good, but it is not equivalent to the capabilities of a human. At least, not yet.
Download the complete 2023 SEO Trends & Predictions report for additional insights and commentary on:
- Content topics of interest for 2023, broken down by title
- In-demand content marketing formats for 2023
- Top 3 content marketing challenges for 2023
The Future of SEO & Content Marketing in 2023
The future of SEO and content marketing in 2023 and beyond looks bright (and busy). Expect more frequent algorithm updates, experimentation with AI content generators, and an increased focus on the user experienceUser Experience
User experience (or UX for short) is a term used to describe the experience a user has with a product.
Learn more in 2023. The tried-and-true marketing strategies outlined in this report will help brands weather whatever economic or industry-specific storms lay ahead. With ongoing economic uncertainty, marketing leaders remain hyperfocused on maximizing efforts in organic search because it produces a high ROI and simultaneously fuels reliable short-term and long-term growth.
Download the 2023 SEO Trends & Predictions report for access to the full data analysis and list of trends and predictions we’ve compiled so you know what to prioritize when adapting your current (and future) SEO and content marketing strategies.