
Organic Website Traffic Industry Benchmarks Report for 2023
Comparing your enterprise website’s organic performance to the latest SEO industry benchmarks is the best way to contextualize YTD data and adapt strategies to maximize results.
Ensure your organic strategy is set up for success for the remainder of 2023 and beyond by seeing how your goals stack up against the latest organic traffic and SEO benchmarks by industry and subindustry.
Why use SEO benchmarks to set objectives?
There are typically two types of benchmarks in digital marketing to understand your SEO performance better. The first type of SEO benchmark involves comparing your current site metrics, like organic sessions, conversions, and keyword rankings, to your historical metrics on a yearly, quarterly, or monthly cadence. This benchmark is a singular view of your brand’s progress. The second type of SEO benchmarking compares your brand against an industry standard.
SEO benchmarking against competitors can be challenging to navigate. There are a wide variety of differences in digital marketing strategies that companies deploy to drive digital awareness. SEO benchmarks by industry are an incredibly valuable way to compare your brand to competitors within the same space, fine-tune your content strategy to maximize visibility in SERP, better understand websiteWebsite
A website is a collection of HTML documents that can be called up as individual webpages via one URL on the web with a client such as a browser.
Learn more traffic trends, and increase organic traffic.
SEO is an ever-changing landscape that requires both a methodical sound strategy and the ability to pivot and adjust with agility. Benchmarks allow digital marketers and SEO experts to create reasonable, measured goals. Leveraging SEO benchmarks also helps you understand where your domain stands in the industry and whether the strategies you’re implementing are helping or not. SEO benchmarking makes it possible to analyze competitors’ digital strategies to unveil which tactics enable them to rise in the ranks and how to tailor your search strategy accordingly.
Organic search traffic benchmarks by industry
Website traffic comes from various channels, including organic, direct, paid, referral, and social. Organic is arguably the most crucial form of traffic since it connects the right audience—with the right search intent at the right funnel stage—to your site via SERPs and helps you answer the questions your customers are asking. It’s also the only channel that produces reliable, long-term traffic. Unlike paid campaigns, there is no end date for the lifespan of a piece of content. An effective piece of keyword-based, value-driven content can continue to rank well for years.
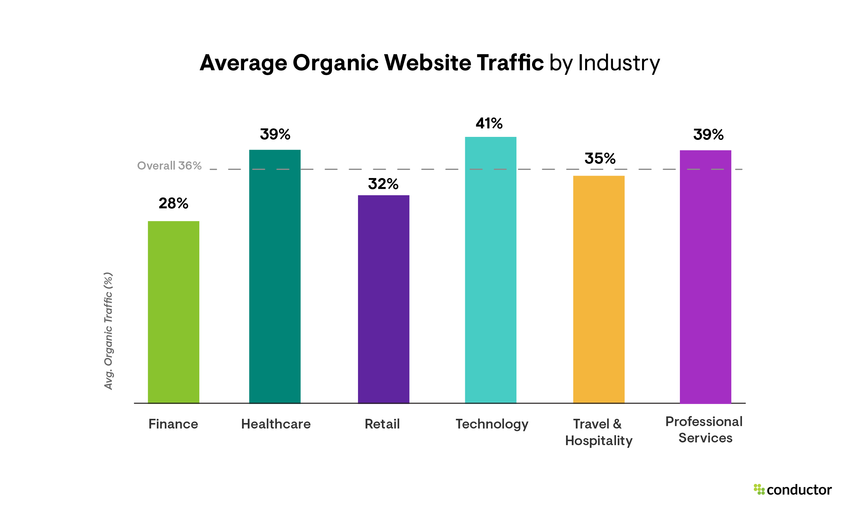
For the 2023 Organic SEO Industry Benchmarks report, we analyzed over 600 enterprise domains and categorized them into six industries: finance, healthcare, retail, technology, travel & hospitality, and professional services.
We found that, on average, organic search produces 36% of overall website traffic for these six key industries.
Download the full report for the organic KPIs and insights you’re missing, including:
- Subindustry-specific organic traffic averages for 2023, for example:
- On average, 32% of overall traffic comes from organic search for the retail industry. Despite a lower traffic benchmark than other industries, the corresponding organic traffic value is the highest of any industry at $21.8M.
- Branded and non-branded organic benchmarks by industry + takeaways
- Top 3 rich search resultSearch Result
Search results refer to the list created by search engines in response to a query.
Learn more types by industry - Leading content providers by subindustry
Branded vs. Non-branded: Organic search traffic benchmarks by industry
To fully understand organic traffic trends and evaluate your site’s organic performance, brands must also look at the branded vs. non-branded breakdown within organic website traffic. This provides the best opportunity to contextualize your results and see where you can leverage paid and organic synergy to increase ROI and drive brand awareness while conserving paid spend for the hyper-competitive keywords you aren’t able to rank for organically.
Each subindustry analyzed in our 2023 SEO benchmarks report includes average branded vs. non-branded organic traffic benchmarks and overall average benchmarks for the industry. The finance branded and non-branded organic traffic benchmarks below show just how much these averages can vary by subindustry.
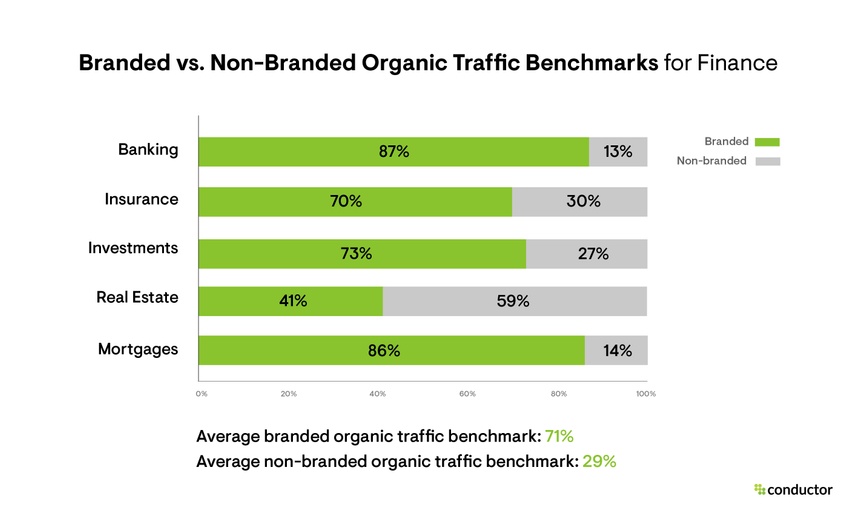
The overall industry-specific branded and non-branded benchmarks are a helpful tool to understand what split to target when starting to dig into your branded and non-branded analytics. Enterprise brands with a comprehensive SEO strategy should rely more on the subindustry-specific rates for a more detailed look at how other direct (and indirect) competitors are pacing.
Top 3 rich SERP result types by industry
Understanding the latest ranks and trends for the top rich search result types by industry can be one of the best ways to gauge if you’re providing the best information—in the right format—for your target audience. We analyzed the prevalence of rich search result types for each primary industry within Conductor to identify the three that appear most often.
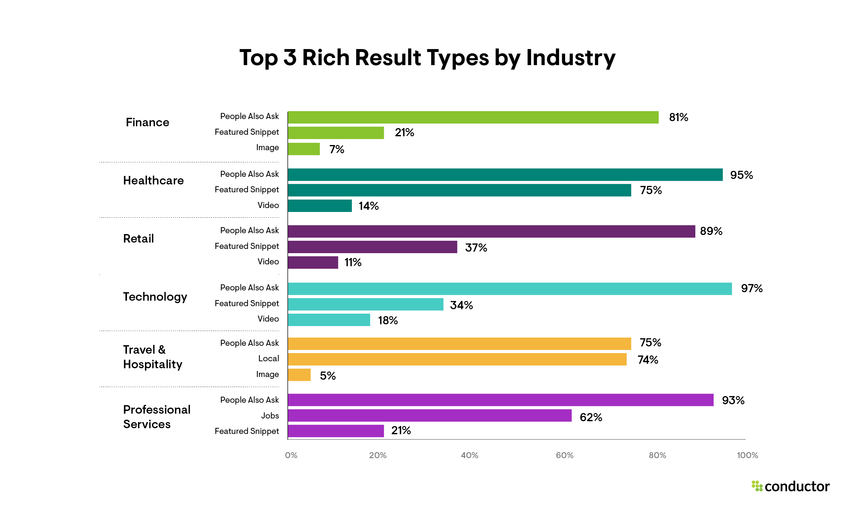
The fact that People Also Ask is the most common rich search result type across all six industries should not be taken lightly. This is why in-depth keywordKeyword
A keyword is what users write into a search engine when they want to find something specific.
Learn more research is vital to ensure you answer your target audience’s most common questions and related follow-up questions in your content.
Optimizing your content to target your industry’s most prevalent rich result types can substantially increase organic traffic as these result types show up first in search results—the most coveted spot on SERPs. Consider adapting your content strategy to account for your industry’s top result types and format content accordingly.
Methodology
Conductor analyzed over 600 enterprise domains and categorized them into six industries. These industries were further categorized into 20 subindustries to unlock more granular-level insights.
As highlighted above, the data in our 2023 benchmarks report has been split into six industries: finance, healthcare, retail, technology, travel & hospitality, and professional services. When deciding which industries—and corresponding subindustries—to feature, we considered a variety of factors. The industries selected were identified as top economic drivers; they are expected to drive significant revenue growth over the next 5-10 years.
The 20 subindustries selected were the most competitive sectors among the core industries listed. Certain subindustries, like car rentals, were not included due to the limited competitionCompetition
Businesses generally know who their competitors are on the open market. But are they the same companies you need to fight to get the best placement for your website? Not necessarily!
Learn more within the grouping (e.g., three primary parent companies owned all major car rental brands in the U.S.).
Additionally, department stores and online retailers like Walmart, Amazon, and Target were excluded from the retail industry data. This was done to provide a more accurate look at organic SEO and traffic trends for an average enterprise domain rather than skewing the data with abnormally high rates from eCommerce giants that specialize across nearly all retail departments.
The initial findings in this report on organic website traffic, branded vs. non-branded breakdowns, and average organic traffic values are based on global website traffic data for desktop devices. The top content providers by subindustry data and the strategic insights that can be gained from it are based on U.S.-specific search data in Google.
Organic benchmark data and the SEO and SERP insights data within this analysis are based on April 2023 data sourced from Conductor and Semrush, one of our certified platform partners.
This report is a snapshot of the SEO landscape and organic benchmarks by industry for 2023. It will be interesting to see how generative AI integration (see Google’s SGE ) on SERPs impacts organic traffic rates, organic visibility, and top content providers moving forward.
Stay tuned for our 2024 report in 12 months to see how this data evolves with the advancement of AI.
How does your site stack up?
Download our 2023 SEO Benchmarks report to find out where your site stands. We compiled and analyzed over 82K searches to determine industry and subindustry organic traffic benchmarks, which top result types appear most often, and of those result types, which domains are owning the conversation.